ggthemes是ggplot2的一个主题扩展包.含有ggplot2的多个扩展主题.官网参考文档见下面链接:
安装
# 从CRAN安装
install.packages('ggthemes', dependencies = TRUE)
# 从github安装
library("devtools")
install_github(c("hadley/ggplot2", "jrnold/ggthemes"))
主题
ggthemes提供的最直接的就是主题.可以直接在ggplot2对象后通过+好添加主题.
theme_base()主题
library("ggplot2")## Warning: package 'ggplot2' was built under R version 3.6.1library(ggthemes)## Warning: package 'ggthemes' was built under R version 3.6.1(
p <- ggplot(mtcars) + geom_point(aes(x = wt, y = mpg,
colour = factor(gear))) + facet_wrap(~am)
)
p + theme_base()
theme_base()有两个参数,base_size和base_family,分别用来设置图片中所有字体的颜色和字体.
theme_calc()主题
library("ggplot2")
library(ggthemes)
(
p <- ggplot(mtcars) + geom_point(aes(x = wt, y = mpg,
     colour = factor(gear))) + facet_wrap(~am)
)
p + theme_calc()
还有很多其他的主题,可以直接参考官方网站.
颜色标度
ggthemes()同样也提供了颜色标度.
色盲友好型颜色调色板和标度
可以参考如下网址:
http://www.cookbook-r.com/Graphs/Colors_(ggplot2)/#a-colorblind-friendly-palette
一共包括四个函数:
colorblind_pal(),scale_colour_colorblind(),scale_color_colorblind()和scale_fill_colorblind().用于分散性的数据.
library("ggplot2")
library("scales")
library(ggthemes)

show_col(colorblind_pal()(8))
##该函数用来给出最多8种颜色的名字library("ggplot2")
library("scales")
library(ggthemes)
show_col(colorblind_pal()(8))
##该函数用来给出最多8种颜色的名字
(
p <- ggplot(mtcars) +
  geom_point(aes(x = wt, y = mpg,
     colour = factor(gear))) +
  facet_wrap(~am)
)
p +
  theme_igray() +
  scale_colour_colorblind()
scale_fill_colorblind()函数和colour函数相同,只是用来填充.
还有很多其他的颜色标度扩展,详情可以看其官方网站.
形状标度
给美学参数shape来提供扩展.
scale_shape_calc()
(
p <- ggplot(mtcars) +
  geom_point(aes(x = wt, y = mpg,
     shape = factor(gear))) +
  facet_wrap(~am)
)
p + scale_shape_calc()
线性标度
给美学参数linetype来提供扩展.
scale_linetype_stata()
library(ggplot2)
require(ggthemes)
(
  p <-
    ggplot(mtcars,aes(mpg, wt)) +
    geom_line(aes(linetype = factor(gear)))
) 
p  +
    scale_linetype_stata()
颜色,形状和线性调色板
提供了非常多的色板,可以看官网.
library(ggthemes)
library(scales)
show_col(few_pal(palette = "Light")(8))
show_col(few_pal(palette = "Medium")(8))
show_col(few_pal(palette = "Dark")(8))
几何对象和统计变换函数
Range Framesgeom_rangeframe
该函数是用来给轴加上直线的.看以下例子.与其他几何对象参数一样,他也可以接受一些常见的参数.
library("ggplot2")
library(ggthemes)
(
p <-
ggplot(mtcars, aes(wt, mpg)) +
 geom_point()
)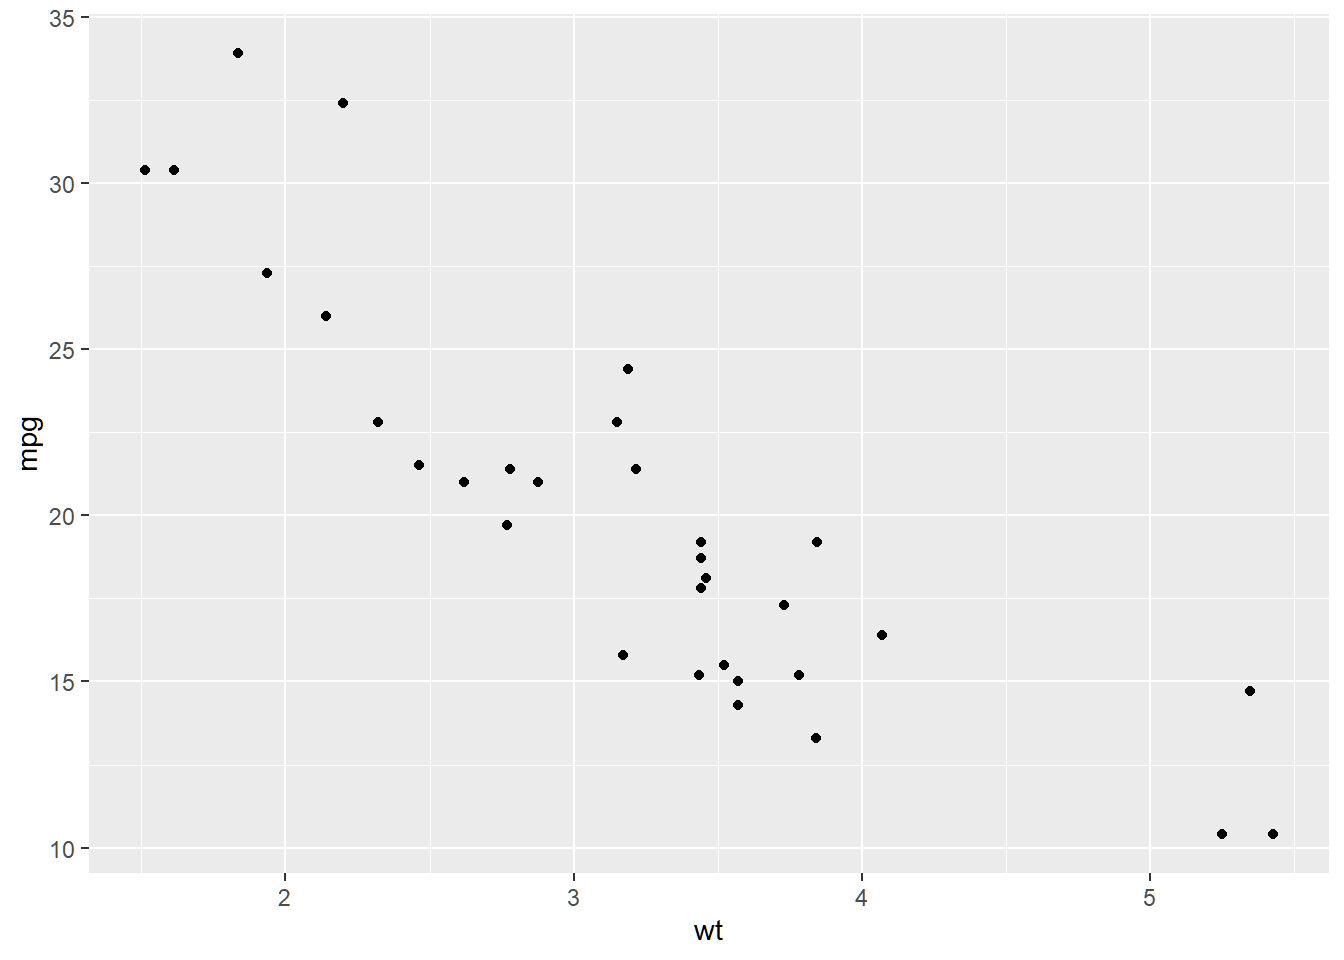
p +
   geom_rangeframe(colour = "red")
p +
   geom_rangeframe(colour = "red", linetype = 2)
p +
   geom_rangeframe(colour = "red", linetype = 2, sides = "top")
p +
   geom_rangeframe(colour = "red", linetype = 2, sides = c("top")) +
  geom_rangeframe(colour = "red", linetype = 2, sides = c("right"))
Tufte’s Box Plot
library("ggplot2")
library(ggthemes)
(
  p <- ggplot(mtcars, aes(factor(cyl), mpg))
)
# with a point for the median and lines for whiskers
p + geom_tufteboxplot()
# with a line for the interquartile range and points for whiskers
p + geom_tufteboxplot(median.type = "line", whisker.type = "point", hoffset = 0)
# with a wide line for the interquartile range and lines for whiskers
p + geom_tufteboxplot(median.type = "line", hoffset = 0, width = 3)
## Warning: position_dodge requires non-overlapping x intervals
# with an offset line for the interquartile range and lines for whiskers
p + geom_tufteboxplot(median.type = "line")
# combined with theme_tufte
p + geom_tufteboxplot() +
  theme_tufte() +
  theme(axis.ticks.x = element_blank())