本文翻译自“The graph gallery”网站,原帖文地址链接:https://www.r-graph-gallery.com/95-violin-plot-with-ggplot2.html.
0.1 基础小提琴图绘制
0.1.1 使用ggplot2包中的geom_violin()函数.
library(ggplot2)
#构建数据
data <- data.frame(
  name = c( rep("A",500), rep("B",500), rep("B",500), rep("C",20), rep('D', 100)),
  value = c( rnorm(500, 10, 5), rnorm(500, 13, 1), rnorm(500, 18, 1), rnorm(20, 25, 4), rnorm(100, 12, 1) )
)

head(data)
## name value
## 1 A 7.269702
## 2 A 9.985260
## 3 A 13.631438
## 4 A 18.297933
## 5 A 12.261669
## 6 A 11.602473# Most basic violin chart
p <-
ggplot(data, aes(x = name, y = value, fill = name)) +
geom_violin() +
theme_bw()
p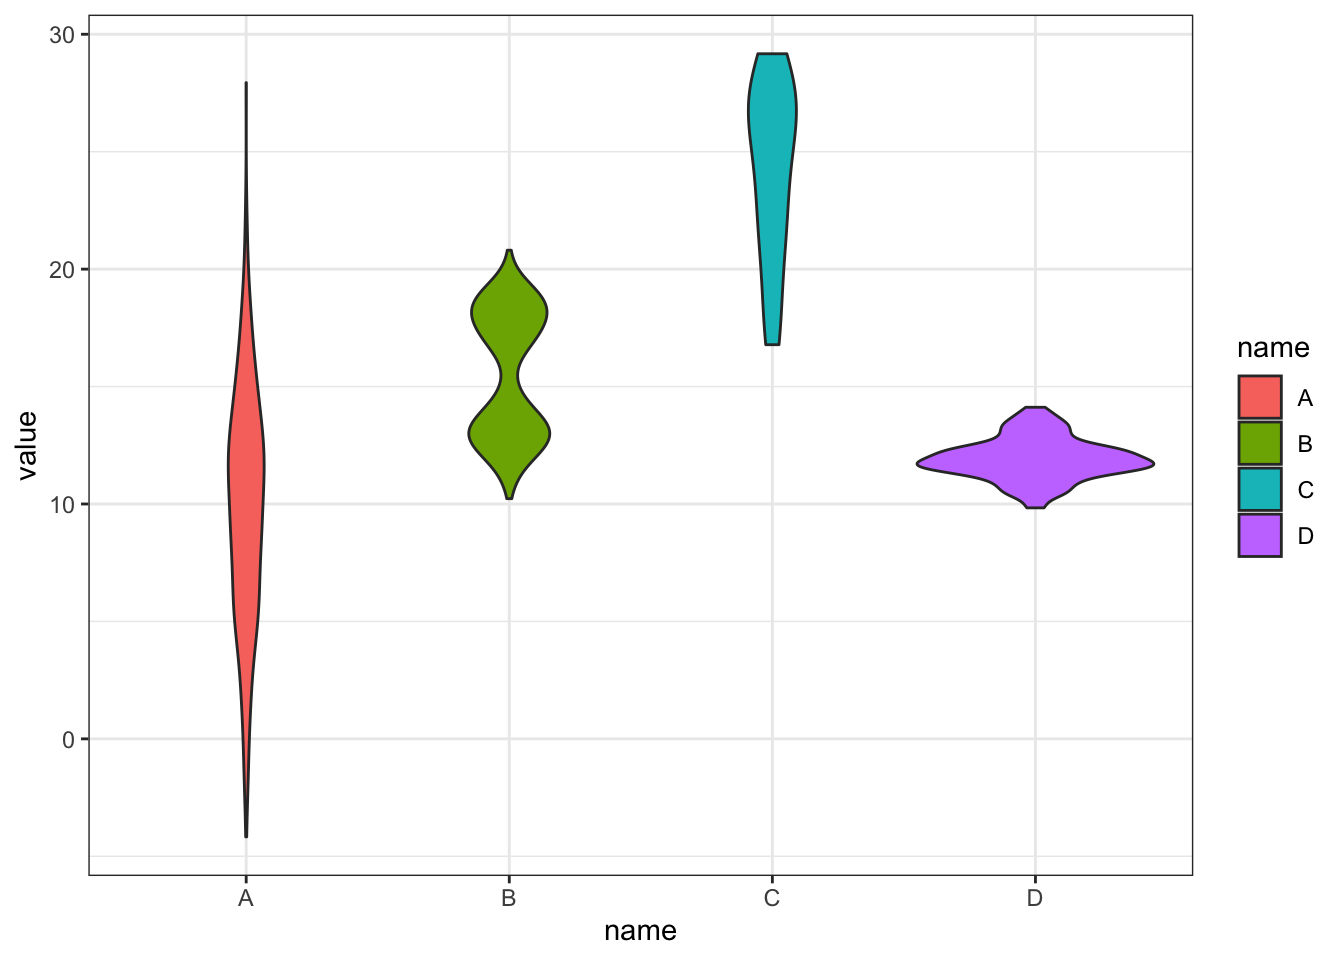
0.1.1.1 数据格式
注意在使用geom_violin()函数构建小提琴图时,数据格式为长数据(long format).每一行时一个观测.一共需要两列:
- 一个分类变量,用于X轴.需要为
factor格式.
- 数值型变量,用于Y轴.
0.1.1.2 数据转换
如果数据为宽数据格式,需要对其进行转变.可以使用tidyr中的pivot_longer()函数将其转变为长数据格式.
data_wide <-
  iris[ , 1:4]
library(tidyverse)
## ── Attaching packages ─────────────────────────────────────── tidyverse 1.3.0 ──## ✓ tibble 3.1.0 ✓ dplyr 1.0.4
## ✓ tidyr 1.1.3 ✓ stringr 1.4.0
## ✓ readr 1.4.0 ✓ forcats 0.5.0
## ✓ purrr 0.3.4## ── Conflicts ────────────────────────────────────────── tidyverse_conflicts() ──
## x dplyr::filter() masks stats::filter()
## x dplyr::lag() masks stats::lag()data_long <-
data_wide %>%
tidyr::pivot_longer(cols = everything(),
names_to = "variable", values_to = "value")
head(data_long)## # A tibble: 6 x 2
## variable value
## <chr> <dbl>
## 1 Sepal.Length 5.1
## 2 Sepal.Width 3.5
## 3 Petal.Length 1.4
## 4 Petal.Width 0.2
## 5 Sepal.Length 4.9
## 6 Sepal.Width 3library(ggplot2)
data_long %>%
ggplot(., aes(variable, value)) +
geom_violin(aes(fill = variable)) +
theme_bw()
0.2 将小提琴图水平展示
library(ggplot2)
library(tidyverse)
  iris[ , 1:4] %>%
  tidyr::pivot_longer(cols = everything(),
                      names_to = "variable",
                      values_to = "value") %>%
  ggplot(., aes(variable, value)) +
  geom_violin(aes(fill = variable, colour = variable)) +
  theme_bw() +
    theme(legend.position = "none") +
    coord_flip()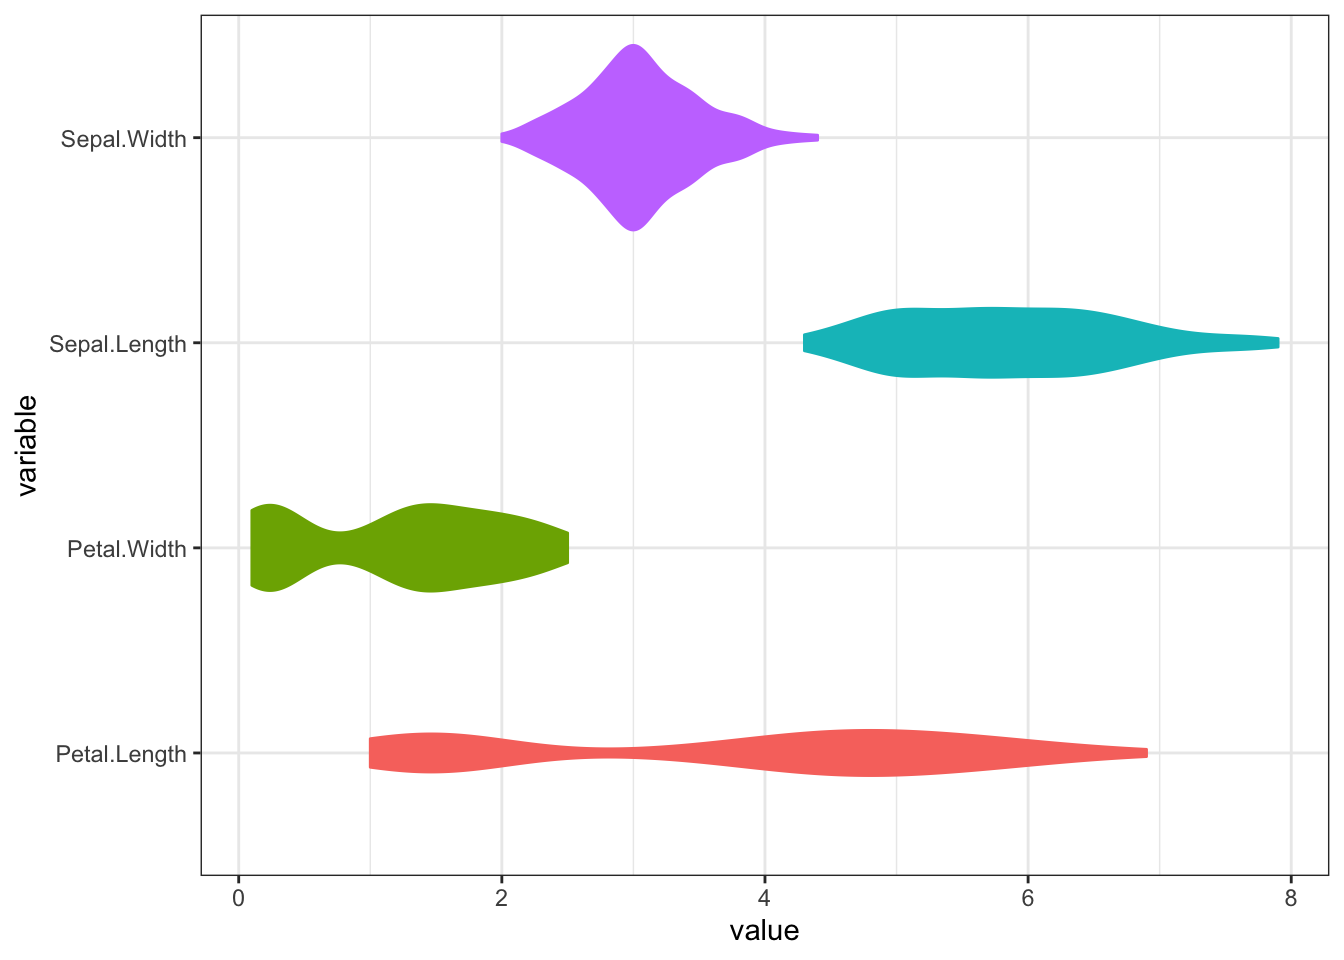
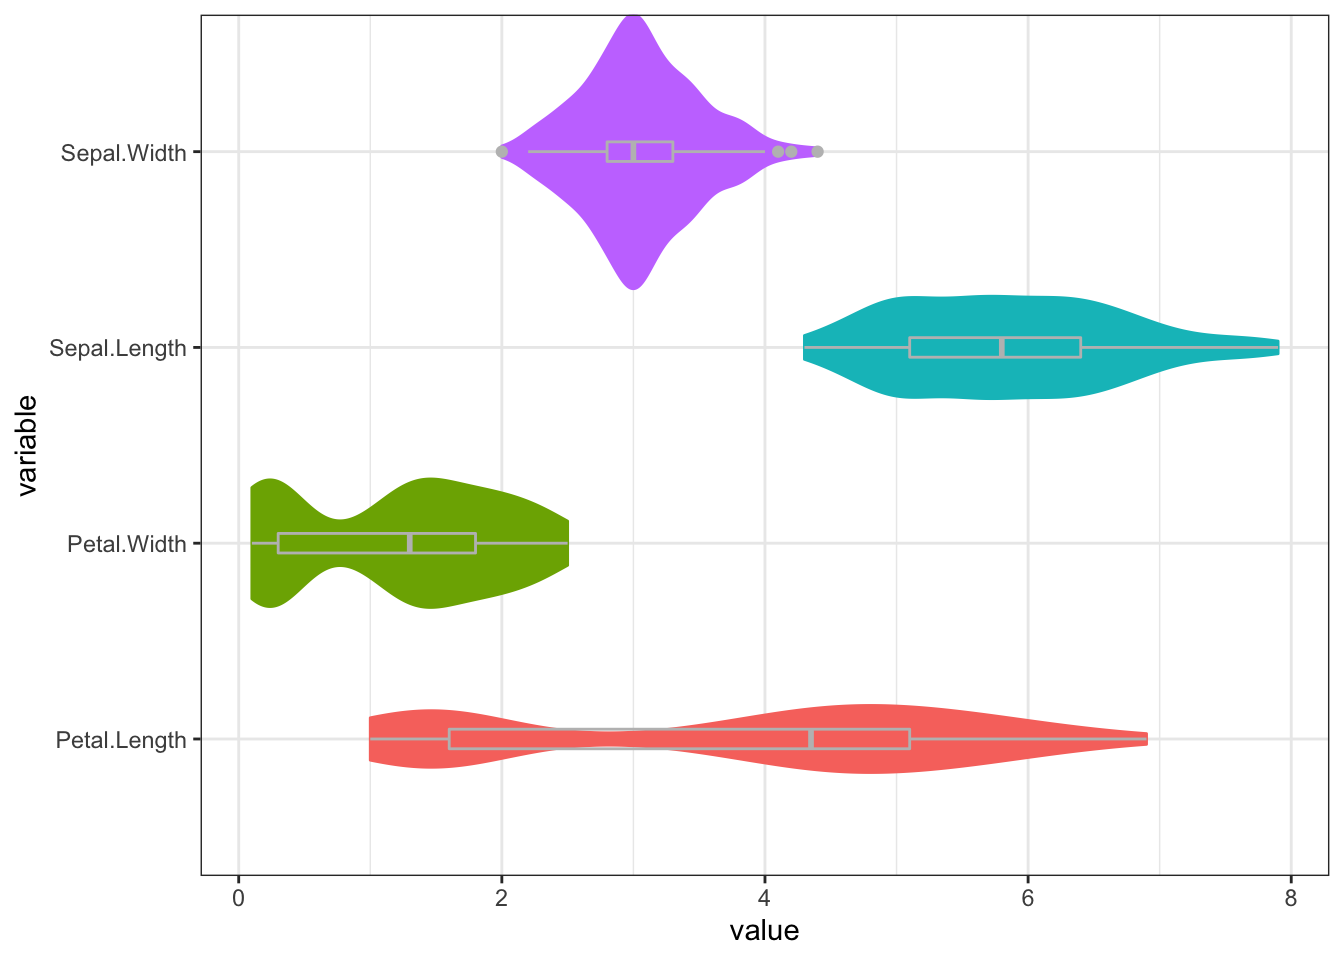
0.3 小提琴图与箱型图同时展示
library(ggplot2)
library(tidyverse)
  iris[ , 1:4] %>%
  tidyr::pivot_longer(cols = everything(),
                      names_to = "variable",
                      values_to = "value") %>%
  ggplot(., aes(variable, value)) +
  geom_violin(aes(fill = variable, colour = variable), width = 1.4) +
    geom_boxplot(fill = NA, width = 0.1, colour = "grey") +
  theme_bw() +
    theme(legend.position = "none") +
    coord_flip()
## Warning: position_dodge requires non-overlapping x intervals